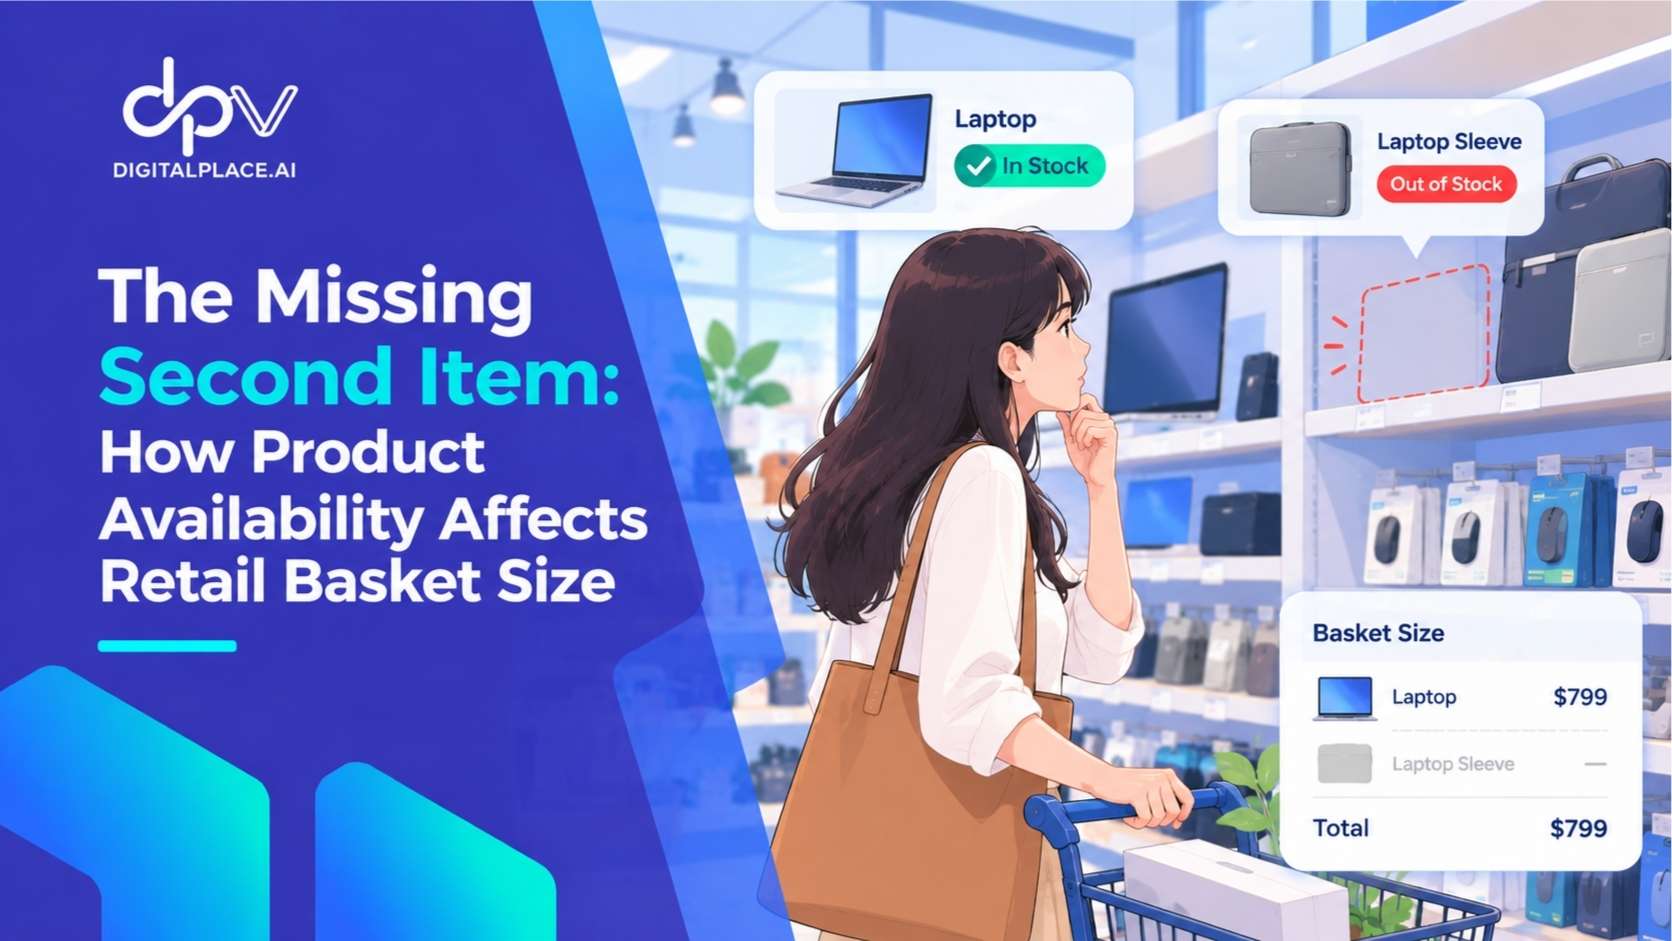
A customer enters an electronics store to purchase a laptop. The laptop is available, the salesperson provides helpful advice, and the customer completes the transaction. From the store’s perspective, the visit is successful. The customer purchased the primary product, conversion was achieved, and revenue was recorded.
However, the customer also intended to purchase a compatible laptop sleeve. Unfortunately, the preferred size was unavailable. Rather than searching for an alternative, the customer decided to purchase the sleeve elsewhere.
The store did not lose the entire transaction. It lost only the additional item.
Read more
Planogram Compliance vs On-Shelf Availability: Why Retailers Need to Measure Both
Growing Retail Revenue Without Increasing Store Traffic: Where Should Retailers Focus?”
This distinction reveals an important but frequently overlooked retail problem: product availability affects not only whether customers purchase, but also how much they purchase in each transaction. A retailer can maintain a healthy conversion rate while consistently missing opportunities to increase basket size because complementary products are unavailable, misplaced, or difficult to find.

 AI-POWERED RETAIL AUDIT
Check Out Our
On-Shelf Availability
Solution
Detect missing products, misplaced SKUs, and planogram issues with AI-powered shelf audits.
Explore Our SolutionFor retail executives, merchandising managers, and store operations teams, understanding these missed opportunities can provide a different perspective on inventory performance and revenue growth.
Retailers Can Lose Sales Without Losing Customers
When retailers discuss the financial impact of stockouts, the conversation often focuses on customers who leave without purchasing. An unavailable product may cause shoppers to abandon their visit, switch stores, postpone a purchase, or select a substitute. These outcomes matter because they can directly influence conversion, customer satisfaction, and future shopping behavior.
Research published in the Journal of Food Products Marketing in 2023 examined how grocery shoppers respond to stockouts. Based on a survey of 1,399 US adults, the study found that customer responses vary, including switching stores or purchasing substitutes. The findings reinforce why stockout consequences cannot be reduced to a single customer behavior.
However, there is another outcome that deserves attention: customers who successfully purchase their primary item but leave without one or more additional products they might otherwise have purchased.
Consider a supermarket shopper purchasing pasta but unable to find the preferred sauce, or a beauty customer purchasing facial cleanser but finding the matching moisturizer unavailable. The retailer still records a transaction, yet the final basket may be smaller than the customer’s original shopping intention.
Conversion measures whether a transaction happened. It does not reveal every product the customer intended to purchase.
This creates a blind spot when retailers evaluate product availability using only total sales and conversion rates.
How Product Availability Influences Retail Basket Size
Average Transaction Value (ATV) and Units Per Transaction (UPT) are useful indicators for understanding basket performance. ATV represents average revenue per transaction, while UPT measures how many units customers purchase in each transaction. The relationship between these metrics is explained in the ATV = UPT × ASP retail basket equation, which separates the effects of basket depth and average selling price.
Product availability can influence both components, but its effect on UPT is particularly relevant when customers purchase complementary products. If shoppers consistently buy a primary item but cannot find an additional product they need, UPT may remain below its potential level even when store traffic and conversion are stable.
The relationship is not automatic. Making more inventory available does not guarantee that customers will buy more. The additional product must be relevant, appropriately priced, visible, and compatible with the customer’s needs. Nevertheless, availability is a necessary condition for an intended purchase to occur at that store.
The Difference Between Substitutes and Complements
Retailers should distinguish between substitute products and complementary products when evaluating availability. A substitute can replace an unavailable item. If a preferred shampoo brand is missing, a customer might purchase another brand from the same category. A complementary product serves a different purpose: it is purchased alongside another item to complete a task, experience, or set of needs.
For example, batteries may complement an electronic device, a protective case may complement a smartphone, and cooking ingredients may complement one another within a planned meal. When a substitute is purchased, the retailer may retain much of the intended transaction. When an important complementary item is missing, the remaining purchase may proceed without replacing that additional item.
That distinction matters because conventional stockout reporting often concentrates on the unavailable SKU, while the commercial consequences of missing complementary products may extend into the composition of the entire shopping basket.
The Missing Second Item: A Hidden Basket Opportunity
Consider a retailer that sells coffee machines. Transaction analysis reveals that customers sometimes purchase coffee filters alongside specific machine models. Management identifies an opportunity to improve product pairing and positions compatible filters near the machines.
The merchandising strategy is reasonable, but the filters frequently disappear from the shelf during busy trading periods. Some customers still purchase the coffee machines without the accessories, leaving the store with an incomplete basket despite successful primary-product sales.
A simplified calculation can illustrate the commercial opportunity.
| Metric | Illustrative Value |
|---|---|
| Monthly eligible primary-product transactions | 500 |
| Current complementary-product availability | 75% |
| Improved availability target | 90% |
| Expected attachment rate when available | 30% |
| Average complementary-product selling price | $12 |
| Estimated incremental revenue opportunity | $270 per month |
The hypothetical calculation is:
500 × (90% − 75%) × 30% × $12 = $270
The example assumes that the attachment rate remains unchanged, additional purchases are genuinely incremental, and customers have not already purchased the complementary item elsewhere. It is an illustrative opportunity estimate, not a prediction of actual sales recovery.
The important insight is that retailers can begin investigating potential basket losses by combining primary-product transactions, complementary-product availability, observed attachment rates, and average selling prices. The calculation also shows why product availability should be assessed in relation to purchasing behavior rather than only SKU-level sales history.
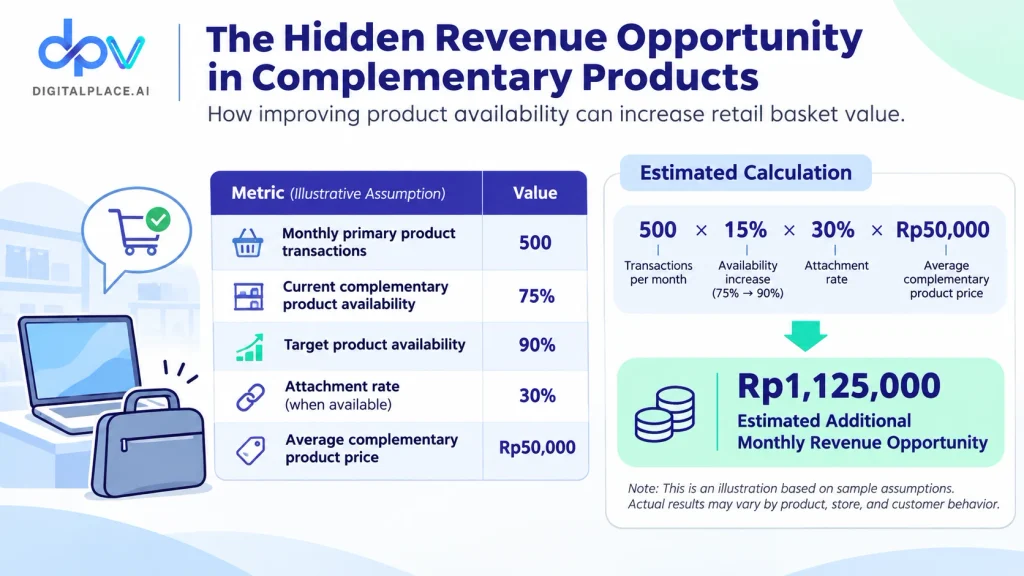
Complementary product availability can influence a retailer’s revenue potential without requiring additional store traffic. For example, with 500 primary product transactions per month, increasing complementary product availability from 75% to 90%, assuming a 30% attachment rate and an average selling price of Rp50,000, could generate an estimated Rp1,125,000 in additional monthly revenue. This calculation illustrates how improving product availability can create opportunities to increase basket size, although actual sales results will still depend on customer demand and store operating conditions.
Product Pairing Creates Value Only When Both Products Are Available
Retailers frequently use cross-merchandising, product bundles, and recommendations to encourage customers to purchase related items. These techniques can be commercially valuable when the combinations reflect genuine customer needs.
A 2024 study published in the Journal of Retailing and Consumer Services, titled Beyond Bundles: Choosing Product Bundles Increases Shopping Basket Size, investigated how presenting complementary products as bundles affects purchasing behavior. Across multiple experiments and supporting analyses, the researchers found that presenting bundles and allowing consumers to select them could increase overall purchases.
The research provides evidence that how complementary products are presented can influence basket size. However, merchandising alone cannot ensure that a product combination is purchasable. If an important component is missing, customers may abandon the additional purchase, choose a different combination, or buy fewer products.
This suggests that retailers should coordinate product pairing strategies with inventory planning and shelf execution. A successful merchandising initiative requires more than identifying products that customers frequently buy together. Stores also need to maintain appropriate availability for those combinations during the periods when demand is most likely to occur.
Inventory Availability Is Not the Same as On-Shelf Availability
A product can exist in inventory records without being accessible to customers. It may remain in the backroom, be positioned in the wrong section, or sit in an unopened carton awaiting replenishment. Inventory systems may also contain inaccuracies that create misleading information about actual stock quantities.
This distinction becomes particularly important for complementary products. A retailer may forecast sufficient inventory for both the primary and secondary items, but poor shelf execution can prevent the intended product pairing from being completed.
A 2026 study published in the Journal of Business Logistics examined inventory record inaccuracy across approximately 24,000 SKUs in 11 grocery stores. In a related field quasi-experiment, researchers found that inventory audits were associated with an approximately 11% increase in store-wide sales over the following two months, with benefits concentrated among items where recorded stock exceeded actual inventory.
Although the study did not directly measure complementary-product attachment or basket-size recovery, it provides evidence that correcting inventory inaccuracies can have meaningful sales implications. Retailers should therefore investigate both whether sufficient inventory exists and whether that inventory is accurately recorded and physically available to shoppers.
Digitalplace.ai addresses these related challenges through AI-powered Inventory Optimization, which supports demand forecasting, replenishment, and inventory allocation decisions, alongside On-Shelf Availability monitoring, which helps identify missing and misplaced products during scheduled shelf checks.
These capabilities support different stages of retail execution. Inventory planning determines where stock should be positioned, while shelf monitoring helps store teams identify situations where products are not available in their expected selling locations.
Which Product Combinations Deserve Priority?
Not every complementary-product relationship deserves the same operational attention. A retailer managing thousands of SKUs should prioritize combinations based on customer relevance, sales opportunity, availability risk, and commercial value. Frequently purchased products may deserve attention, but frequency alone is insufficient if additional sales produce little contribution margin or require disproportionate inventory investment.
A practical approach begins with transaction data. Retailers can identify primary products that frequently appear alongside secondary products and measure the attachment rate for each combination. They can then investigate whether attachment rates are lower in stores or periods where the complementary products experience recurring availability problems.
For example, if similar stores sell the same primary item but consistently achieve different accessory attachment rates, management can investigate shelf availability, product placement, local demand, pricing, and staff recommendations. Differences should not automatically be attributed to stockouts, but they can reveal where further investigation is worthwhile.
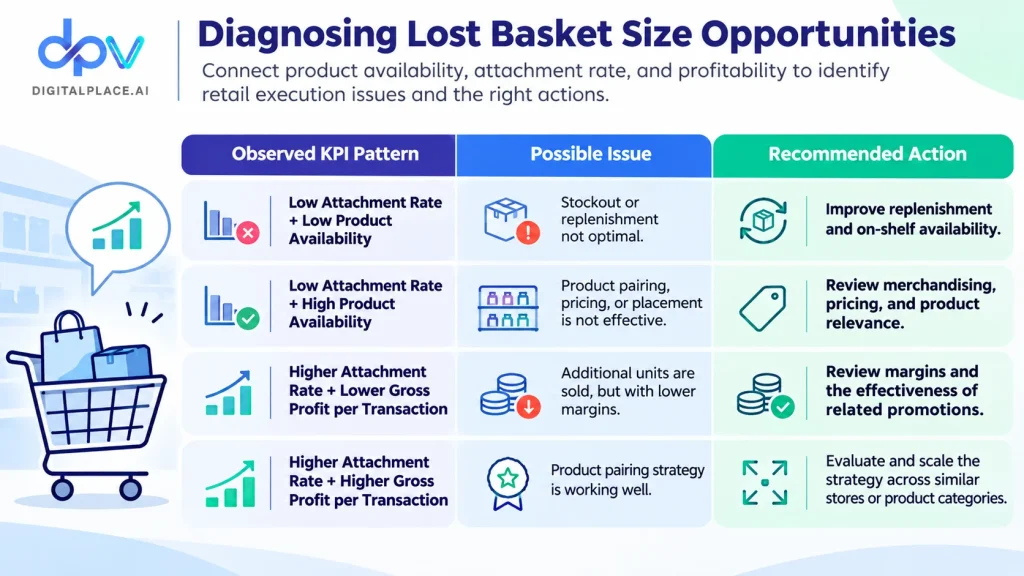
Identifying the Causes of Lost Basket Size Opportunities
A low attachment rate—the percentage of transactions that include a complementary product—is not always caused by stockouts. When both attachment rate and product availability are low, retailers should evaluate their replenishment processes and on-shelf availability. However, if products are consistently available but attachment rates remain low, the underlying issue may be related to product placement, merchandising strategies, pricing, or the relevance of complementary products to customer needs.
Retailers should also evaluate the relationship between attachment rates and profitability. An increase in the number of products purchased per transaction does not necessarily translate into higher profits, particularly when additional products have low margins or rely heavily on discounts. By analyzing attachment rate, product availability, and gross profit per transaction together, retailers can identify opportunities to increase basket size, prioritize operational improvements, and determine which product pairing strategies are worth expanding across more stores.
Three Metrics That Can Reveal Missed Basket Opportunities
Retailers can supplement traditional availability and sales reporting with three practical measurements.
- Complementary Product Attachment Rate: The percentage of eligible primary-product transactions that include a specified complementary product. This indicates how frequently the product pairing occurs, although it does not independently establish why customers did or did not purchase the additional item.
- Complementary Product Availability: The percentage of relevant selling periods or observed shelf checks during which the complementary SKU is available for purchase. This provides context for interpreting changes in attachment rates.
- Gross Profit per Eligible Transaction: The gross profit generated across transactions involving a selected primary product, whether or not the complementary item was purchased. This helps management evaluate whether basket-building initiatives improve profitability rather than simply increasing unit counts.
These measures become more valuable when analysed together. A falling attachment rate alongside recurring shelf gaps may suggest an availability problem worth investigating. By contrast, declining attachment despite strong availability may indicate changes in customer preferences, merchandising, pricing, or product compatibility.
A Practical Store-Level Approach to Recovering Missed Basket Sales
Retailers do not need a complex predictive model to begin investigating missing complementary purchases. A focused pilot can compare a small number of meaningful product combinations across stores with similar characteristics.
Start by selecting several primary products with established complementary purchasing patterns. Measure their attachment rates, monitor the availability of relevant secondary products, and identify periods when shelf gaps are common. Store teams can then introduce targeted corrective actions, such as adjusting replenishment timing, improving product placement, or prioritizing the shelf availability of important accessories.
The results should be evaluated against a suitable baseline or comparable stores, accounting for promotions, seasonality, and changes in customer demand. Management should examine attachment rates, UPT, ATV, and gross profit per transaction together rather than assuming that an improvement in one metric proves that the intervention was successful.
Digitalplace.ai’s focus on inventory decisions and store execution is relevant to this challenge because product availability depends on coordinated decisions across planning, allocation, replenishment, and shelf management. The commercial objective is not to maximize every SKU’s inventory level, but to improve the availability of products that matter to customers while managing inventory costs and working capital responsibly.
Conclusion: A Successful Transaction Can Still Be an Incomplete Basket
Retailers often interpret completed transactions as evidence that customer demand has been successfully captured. Yet a transaction can be completed even when one or more products the customer intended to purchase were unavailable.
This creates a business opportunity that may not appear clearly in conversion reports or conventional stockout dashboards. Complementary-product availability can influence basket depth, transaction value, and the retailer’s ability to satisfy customers’ broader shopping needs.
The question is not simply whether customers found something to buy. It is whether the retailer made the relevant products available for customers to complete their intended purchases.
By connecting transaction data, attachment rates, inventory availability, and shelf execution, retailers can develop a more complete understanding of basket performance. The goal is not to force additional items into every transaction, but to ensure that customers can conveniently purchase the products they genuinely need together.
For retail management, the missing second item is more than a merchandising issue. It is a reminder that inventory decisions and store execution influence how effectively existing customer demand becomes realized sales.