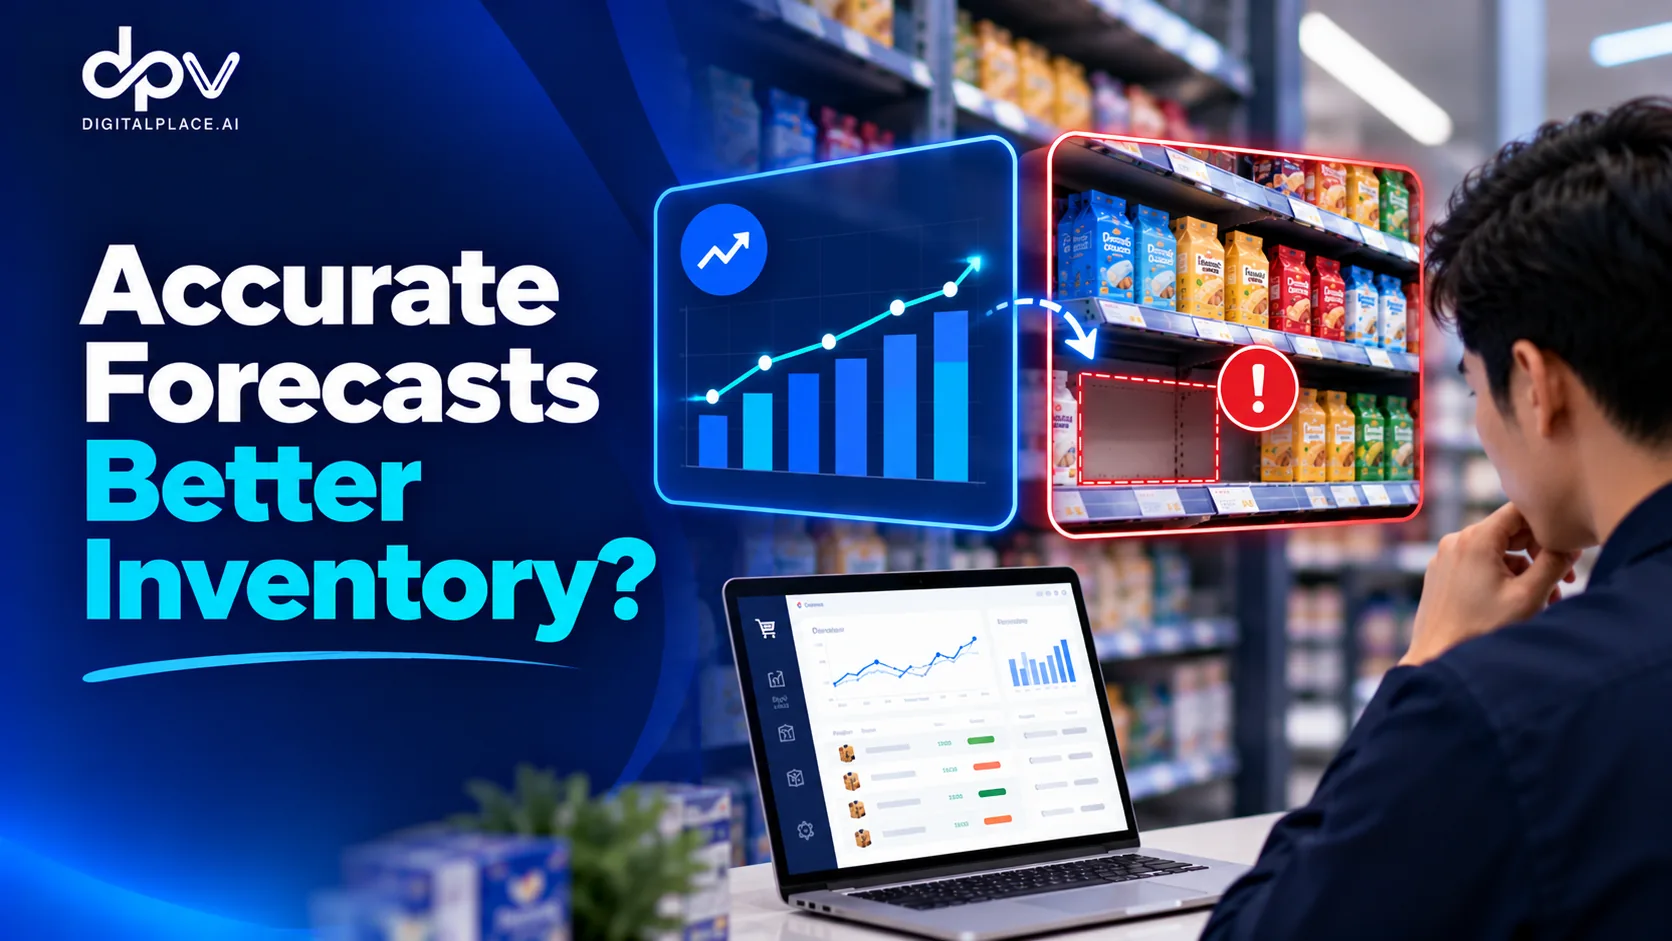
Imagine a retail company reviewing its latest demand forecasting results. After investing in better forecasting models, the planning team reports that prediction errors have declined significantly. The forecasts are now closer to actual sales, and management considers the improvement an important milestone.
Yet store managers continue reporting out-of-stock products, while distribution centers are still holding excess inventory. Some locations have more stock than they need, whereas others struggle to replenish popular items on time.
How can inventory problems persist when demand forecasts are becoming more accurate?
The answer lies in an important distinction: forecast accuracy measures how well a business predicts demand, while inventory performance depends on the decisions made using those predictions. A retailer may forecast demand reasonably well but still order the wrong quantities, replenish too late, or allocate inventory to locations where it is less likely to sell.
For retailers managing thousands of SKUs across multiple stores and distribution centers, understanding this difference is essential. Improving demand forecasts is valuable, but translating those forecasts into better inventory decisions requires additional planning capabilities, operational data, and clearly defined business objectives.
Key Takeaways
- More accurate demand forecasts can improve inventory planning, but they do not automatically eliminate stockouts or excess inventory.
- Inventory performance also depends on supplier lead times, replenishment frequency, safety stock, order constraints, and stock allocation.
- Forecast accuracy metrics such as MAPE, MAE, and WAPE measure prediction errors, not the complete financial or operational consequences of inventory decisions.
- Research shows that the relationship between forecast accuracy and inventory performance varies according to inventory policies, demand characteristics, and the costs of holding or losing inventory.
- Retailers should evaluate forecasting and inventory optimization together, using business outcomes such as product availability, inventory turnover, service levels, and working capital.
The Forecast Can Be Accurate While the Inventory Decision Is Wrong
Demand forecasting estimates what customers are likely to buy over a given period. For example, a forecasting model may predict that a supermarket will sell an average of 20 units of a particular shampoo SKU per day during the coming week.
If actual demand averages 21 units per day, the forecast is reasonably close to reality. However, this information alone does not tell the retailer whether its inventory decisions are appropriate.
The retailer still needs to determine when to place replenishment orders, how much stock to maintain, and how inventory should be distributed between stores and distribution centers. These decisions depend on operational factors that are not fully captured by a demand forecast.
A supplier may require four days to deliver additional stock, while the store receives scheduled replenishment only twice per week. The distribution center may also have limited inventory available for allocation, or the supplier may impose minimum order quantities that prevent the retailer from ordering precisely what it needs.
Under these conditions, a highly accurate demand forecast can still lead to poor inventory outcomes if the replenishment rules, safety stock policies, or allocation decisions are inappropriate.
The problem is not necessarily the quality of the demand prediction. It may be the way that prediction is converted into an inventory decision.
This distinction becomes particularly important in retail networks where the same SKU behaves differently across locations. A product may sell consistently in one store but experience strong weekend demand in another. Applying similar replenishment rules to both locations may create unnecessary inventory in one while exposing the other to stockout risks.
Same Demand Forecast, Different Inventory Outcomes
Consider two retailers selling the same product under similar demand and supplier conditions. Both forecast average demand of 20 units per day, and both work with a supplier requiring four days to deliver replenishment.
The difference lies in their inventory policies.
| Inventory Parameter | Retailer A | Retailer B |
|---|---|---|
| Forecast demand | 20 units/day | 20 units/day |
| Supplier lead time | 4 days | 4 days |
| Expected demand during lead time | 80 units | 80 units |
| Safety stock | 10 units | 40 units |
| Reorder point | 90 units | 120 units |
| Actual demand during lead time | 100 units | 100 units |
| Illustrative outcome | 10-unit shortfall | 20 units remaining |
For this simplified example, the reorder point is calculated as:
Reorder Point = Expected Demand During Lead Time + Safety Stock
Both retailers use the same forecast and supplier lead time, but Retailer A maintains 10 units of safety stock while Retailer B maintains 40 units.
Now assume actual demand increases to 25 units per day during the four-day lead time, resulting in total demand of 100 units before replenishment arrives.
Under the assumptions of this example, Retailer A could face a 10-unit shortfall, while Retailer B would retain 20 units before receiving additional inventory.
The forecasts are identical, but the inventory outcomes differ because the retailers apply different safety stock policies.
However, Retailer B’s higher safety stock is not automatically the better decision. Maintaining additional inventory increases holding costs and working capital requirements. If demand remains consistently below expectations, the retailer may carry more inventory than necessary.
The appropriate safety stock therefore depends on demand variability, supplier reliability, replenishment frequency, inventory costs, and the desired service level.
This example illustrates a central principle of inventory optimization: the objective is not simply to prevent every possible stockout by holding more inventory, but to balance product availability against the costs and risks of carrying stock.
 INTERACTIVE INVENTORY DECISION SIMULATOR
Same Demand Forecast. Different Inventory Outcomes.
Compare two retailers with identical demand forecasts but different safety stock policies. Move the sliders to see how a demand increase or supplier lead time changes their inventory position before the next delivery.
Projected inventory balance before replenishment
Illustrative units remaining; values below zero indicate potential unmet demand
Adjust the inventory scenario
Same for both: Forecast = 20 units/day. Reorder point = forecast demand during lead time + safety stock.
With 25 units/day of actual demand over four days, Retailer A could fall short by 10 units, while Retailer B would retain 20 units before delivery.
Educational illustration, not a customer case study or a stockout probability model. Assumes constant daily demand, an order placed when inventory position reaches the reorder point, no existing outstanding orders or backorders, and replenishment arriving at the end of lead time. Negative projected balances represent unmet units, not physically negative stock. Higher safety stock improves protection in this scenario but also increases inventory held.
Why Better Forecast Accuracy Does Not Guarantee Better Inventory Performance
Several operational factors influence inventory outcomes after a demand forecast has been generated. Even when the forecast is accurate, weaknesses in these areas can prevent a retailer from achieving the expected improvements in product availability or inventory efficiency.
Supplier Lead Times and Delivery Variability
A forecast may correctly estimate average demand, but replenishment cannot always arrive precisely when needed. Supplier lead times vary because of production schedules, transportation conditions, delivery capacity, and other operational constraints.
For example, a retailer may forecast demand accurately based on a four-day supplier lead time. If deliveries occasionally require six days, the inventory policy must account for the additional uncertainty. Otherwise, stock may run out before replenishment arrives, even when the original demand forecast was correct.
Improving forecasting accuracy alone cannot eliminate this problem. Retailers also need reliable lead-time information and inventory policies that account for variation in supply conditions.
Safety Stock and Service-Level Decisions
Safety stock provides protection against uncertainty in demand and replenishment. However, fixed safety stock rules may become less appropriate as customer demand, supplier performance, and product characteristics change.
A fast-moving personal care product with stable demand may require a different inventory policy from a seasonal product with unpredictable sales. Applying the same stock buffer across both products can increase unnecessary inventory or expose certain SKUs to higher stockout risks.
Effective inventory planning therefore requires safety stock decisions that reflect actual demand variability, supplier conditions, and service-level objectives rather than relying exclusively on historical averages or fixed quantities.
Replenishment Frequency and Order Constraints
Retailers often operate within predefined purchasing and delivery schedules. A supermarket may receive shipments from its distribution center on selected weekdays, while certain suppliers require minimum order quantities or fixed case-pack multiples.
These constraints influence when and how much inventory can be replenished. Even if a forecast accurately predicts weekly demand, the retailer must translate that information into orders that can satisfy demand between scheduled deliveries.
A product that sells quickly during weekends may require inventory to arrive before the demand occurs. If the replenishment schedule does not account for this timing, stores may experience stockouts despite relatively accurate weekly forecasts.
Inventory Allocation Across Locations
Forecasting accuracy at the network level does not guarantee that inventory is distributed appropriately across individual stores.
Consider a retailer operating 100 branches. Total demand may be forecast accurately, but certain stores may sell significantly more than expected while others sell less. If inventory allocation does not reflect these differences, the retailer can experience stockouts and overstock simultaneously.
This problem becomes more challenging when distribution centers have limited stock and must prioritize replenishment across multiple locations. Retailers need allocation decisions that consider store-level demand, available inventory, delivery constraints, and business priorities.
Inventory Record Accuracy and Execution
Even well-designed inventory recommendations depend on reliable operational data. If inventory records are inaccurate, a replenishment system may assume that stock is available when the physical inventory is missing or stored in an unexpected location.
Similarly, products may be available in a store's backroom but absent from the shelf because replenishment has not been completed. In these situations, neither forecasting accuracy nor inventory planning alone can guarantee product availability.
Retailers must therefore connect inventory decisions with reliable stock records and consistent execution across warehouses, distribution centers, and stores.
What Research Reveals About Forecast Accuracy and Inventory Performance
The relationship between forecasting accuracy and inventory performance has been examined in academic research, and the findings reinforce the importance of evaluating business outcomes rather than prediction errors alone.
A study published in the European Journal of Operational Research in 2025, titled “Forecast Accuracy and Inventory Performance: Insights on Their Relationship from the M5 Competition Data,” investigated how different forecasting methods influence inventory costs.
The researchers analyzed retail demand data from the M5 forecasting competition and simulated inventory decisions under different inventory policies, demand patterns, and cost assumptions.
Their findings suggest that the relationship between forecast accuracy and inventory performance can be relatively weak, depending on the characteristics of the products, inventory control policies, and the relative costs of holding inventory versus lost sales.
Importantly, the researchers found that the forecasting method producing the lowest prediction error was not necessarily the method delivering the most favorable inventory outcome under every cost scenario.
This finding does not mean accurate forecasting is unimportant. Instead, it indicates that forecasting methods should be evaluated according to how their predictions influence inventory decisions and the resulting costs.
A related concept in operations research is known as predict-then-optimize. Traditional predictive models are often designed to minimize forecast errors, while the subsequent optimization process determines what actions should be taken.
Research on Smart Predict-then-Optimize, published in Management Science, explores how predictive models can account more directly for the decisions they support. Although the framework extends beyond inventory management, it reinforces the broader principle that prediction quality and decision quality are not identical.
For retailers, this creates an important shift in perspective. The question is no longer limited to whether a forecasting model produces a lower error rate, but whether the resulting inventory decisions improve availability, reduce unnecessary stock, and support the business's operating objectives.
Why Forecast Accuracy Metrics Are Not Enough
Forecast accuracy metrics remain important because retailers need to understand how closely predicted demand matches observed outcomes. Common measures include Mean Absolute Percentage Error (MAPE), Mean Absolute Error (MAE), and Weighted Absolute Percentage Error (WAPE).
However, these metrics evaluate different aspects of prediction error and do not directly capture inventory costs or operational results.
| Measurement Area | Common Metrics | What They Help Evaluate |
|---|---|---|
| Forecast accuracy | MAPE, MAE, WAPE | How closely forecasts match observed demand |
| Forecast bias | Mean Error, Bias Percentage | Whether forecasts consistently overestimate or underestimate demand |
| Product availability | Stockout Rate, Service Level | How effectively inventory supports customer demand |
| Inventory efficiency | Inventory Turnover, Days of Inventory | How productively inventory is managed |
| Financial performance | Holding Costs, Lost Sales, Working Capital | The financial consequences of inventory decisions |
A retailer may reduce MAPE while continuing to experience excess inventory because its safety stock or replenishment policies remain unchanged. Another retailer may accept slightly higher forecast errors while achieving better service levels through more appropriate inventory buffers and replenishment decisions.
The choice of forecasting metric also matters. For example, MAPE becomes problematic when actual demand is zero or close to zero, a situation commonly encountered with intermittent-demand products. Retailers managing large assortments should therefore select forecasting metrics appropriate to their demand patterns instead of relying on a single measure across every SKU.
There is another complication: recorded sales are not always equal to actual customer demand. When a product is out of stock, the sales history may reflect constrained availability rather than the quantity customers would have purchased if the product had remained available.
Without accounting for these situations, a forecasting model may underestimate demand for products that frequently experience stockouts, creating a cycle in which insufficient inventory leads to lower recorded sales and potentially lower future forecasts.
A more comprehensive evaluation combines forecasting metrics with inventory outcomes, allowing retailers to determine whether model improvements are translating into meaningful operational benefits.
From Demand Forecasts to SKU-Level Inventory Decisions
Turning forecasts into better inventory performance requires a decision-making process that accounts for the conditions affecting each SKU and location.
The forecast provides an estimate of expected demand, but replenishment decisions must also consider current inventory, stock already on order, lead times, safety stock requirements, and operational constraints.
For example, a retailer may predict that a particular product will sell 150 units during the next planning period. However, this does not necessarily mean the store should order 150 units.
The store may already have 80 units available and another 50 units scheduled to arrive. The supplier may also require orders in multiples of 24 units, while delivery schedules determine when replenishment can reach the store.
The appropriate order quantity must account for these factors rather than simply matching the forecasted demand.
For multi-store retailers, the decision becomes more complex because available inventory may need to be distributed across locations with different demand patterns. A store approaching a stockout may require higher allocation priority than another location holding sufficient inventory for several weeks.
A connected inventory planning process can therefore use demand forecasts to support several interrelated decisions: replenishment quantities, reorder timing, stock allocation, inventory targets, and exceptions requiring planner review.
These decisions should be revisited as new demand and inventory information becomes available. Depending on the retailer's operating model, daily planning cycles can incorporate updated sales, inventory positions, supplier information, and changes in demand conditions.
The goal is not to continuously change inventory quantities without clear operational justification, but to ensure that replenishment and allocation decisions remain aligned with actual business requirements.
How Digitalplace.ai Connects Forecasting With Inventory Decisions
For retailers operating complex store and distribution networks, the challenge is often not a lack of forecasting information. It is the difficulty of converting that information into consistent, actionable inventory decisions across thousands of SKU-location combinations.
This is where AI-powered inventory optimization becomes relevant.
Digitalplace.ai approaches inventory planning by connecting demand forecasting with replenishment optimization and stock allocation. Rather than treating predicted sales as the final output, the solution uses demand forecasts alongside inventory levels and operational rules to support decisions about how much stock is required and where it should be positioned.
Its capabilities include demand forecasting at SKU and location level, replenishment recommendations, and inventory allocation across stores and distribution centers. These functions are designed to help retailers improve product availability while reducing unnecessary excess inventory.
The distinction matters because retailers may already have forecasting systems but still depend on manual spreadsheets, fixed replenishment parameters, or inconsistent inventory rules to determine actual stock movements.
An inventory optimization approach provides a framework for connecting these decisions more systematically, while allowing planning teams to focus on exceptions and operational requirements that need further attention.
For organizations looking to improve both forecasting and inventory outcomes, the AI-Powered Inventory Optimization solution from Digitalplace.ai is designed to support this connection between demand intelligence, replenishment, and inventory allocation.
Ultimately, the value of inventory optimization should be evaluated through measurable improvements in operational performance, including product availability, inventory productivity, and working-capital efficiency.
Building a Better Inventory Performance Framework
Retailers seeking stronger inventory outcomes should evaluate demand forecasting and inventory optimization as parts of the same planning process.
Forecast accuracy remains an important measure of how well the business understands future demand. However, inventory performance requires an additional assessment of how that information influences ordering, replenishment, and allocation decisions.
A practical performance framework should examine the relationship between forecasting improvements and outcomes such as service levels, stockout frequency, inventory turnover, holding costs, and working capital.
It should also evaluate these results at an appropriate level of detail. Improvements in aggregate inventory performance may conceal continuing problems affecting individual stores or high-priority SKUs. Comparing results by category, product characteristics, and location can help retailers identify where their planning policies require further adjustment.
Over time, this approach can support a more balanced planning objective: maintaining sufficient product availability without carrying inventory that does not contribute meaningfully to customer demand.
Conclusion: Better Forecasts Matter, but Better Decisions Deliver Results
More accurate demand forecasts can provide retailers with valuable information about future customer demand. However, forecasting accuracy alone does not determine whether products will be available when customers need them or whether inventory is being managed efficiently.
Supplier lead times, replenishment schedules, safety stock policies, inventory allocation, and operational execution all influence the results that forecasting models ultimately help produce. When these factors are not considered together, retailers can continue experiencing stockouts and excess inventory even as forecast accuracy improves.
Academic research reinforces this distinction by showing that lower prediction errors do not always translate directly into lower inventory costs or better operational outcomes.
The next step for retailers is therefore to evaluate not only how accurately they predict demand, but also how effectively those predictions support inventory decisions.
Better forecasting helps retailers understand what may happen. Better inventory decisions determine how effectively they respond.
For retail businesses managing large assortments and multiple locations, combining the two is essential to achieving stronger inventory performance.