

Retailers often spend enormous effort deciding what products to stock, how much inventory to carry, and how frequently stores should be replenished. But there is another question that is just as important: how effectively is the store using the physical space it already has?
Every square foot of retail space has a cost. Rent, utilities, fixtures, maintenance, labor, and inventory all sit behind that space. A section that looks attractive but generates little sales may be consuming valuable capacity. Conversely, a compact area with strong product demand, good visibility, and the right assortment may generate significantly more revenue than its physical size suggests.
Read more
ATV = UPT × ASP: The Retail Basket Equation Behind Bigger Transactions
Retail KPIs Are the Engine, Not the Rearview Mirror
That is why Sales per Square Foot remains one of the most useful Store Productivity Key Performance Indicators (KPIs) in physical retail.
It does not simply tell retailers whether sales are growing. It asks a more operational question:
Is the space inside the store producing enough sales for the area it occupies?
What Is Sales per Square Foot?
Sales per Square Foot measures the amount of sales revenue generated relative to the selling area of a retail store.
The basic formula is:
Sales per Square Foot = Total Store Sales ÷ Selling Area in Square Feet
For example, suppose a specialty retailer generates USD 1.2 million in annual sales from a 6,000-square-foot selling area.
USD 1,200,000 ÷ 6,000 = USD 200 per square foot
This means that, on average, every square foot of selling space generates USD 200 in annual sales.
The metric can be calculated at several levels. A retailer might measure an entire store, compare branches, analyze individual departments, or even evaluate specific product zones. Measuring only at store level provides a useful overview, but the deeper operational value often appears when retailers start comparing how different areas of the store perform.
A supermarket, for example, might discover that chilled beverages use relatively little space but generate strong sales, while a large household-goods section occupies considerably more floor space without producing proportional revenue. A fashion retailer might find that accessories generate higher revenue per square foot than certain apparel categories despite requiring much smaller display areas.
The KPI therefore becomes more than a finance metric. It becomes a way to connect space, assortment, merchandising, inventory, and customer demand.
High Sales per Square Foot Does Not Automatically Mean Better
At first glance, maximizing sales per square foot sounds obvious. If one store generates USD 700 per square foot while another generates USD 400, the first store appears more productive.
But retail space cannot be managed by maximizing a single number.
A store needs aisles wide enough for customers to move comfortably. Premium retailers may deliberately use more open space to create a particular shopping experience. Furniture stores require substantial display areas even when transactions are relatively infrequent. Grocery stores need refrigeration, fresh-food displays, promotional zones, and checkout areas that may serve important operational purposes even if their direct sales productivity differs.
The objective is therefore not simply to squeeze more merchandise into every available area.
The better question is:
Does each part of the store justify the space allocated to it based on its role in the overall retail operation?
Some space generates direct sales. Some helps customers navigate. Some supports discovery. Some improves conversion in nearby categories. Other space may support service, brand experience, or operational flow.
Sales per square foot is powerful precisely because it starts the conversation, rather than finishing it.
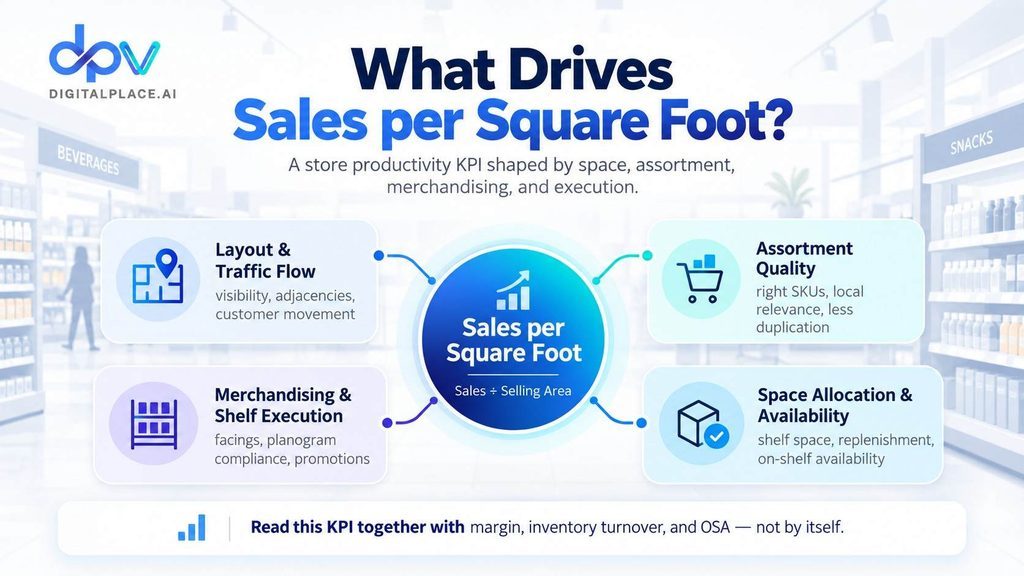
This infographic explains the main factors that influence Sales per Square Foot, a key retail store productivity metric calculated as sales divided by selling area. It highlights four operational drivers—layout and traffic flow, assortment quality, merchandising and shelf execution, and space allocation and availability—showing how each can affect how efficiently a retailer converts physical store space into sales. The graphic also emphasizes that Sales per Square Foot should not be evaluated in isolation, but alongside other indicators such as margin, inventory turnover, and On-Shelf Availability (OSA) to provide a more complete view of store performance.
Store Layout Can Quietly Determine Space Productivity
Two stores carrying almost identical products can produce very different results because of layout.
Where products are located affects visibility, traffic flow, dwell time, impulse purchases, cross-selling, and the likelihood that customers encounter particular categories. A high-demand product hidden in a low-traffic area can underperform despite strong underlying demand, while a highly visible promotional display may generate significant incremental sales.
Consider a large electronics store. Customers may enter intending to buy a smartphone, but the path toward the smartphone section exposes them to cases, chargers, headphones, and accessories. The productivity of those small accessory zones may be extremely high because they combine limited space with strong attachment opportunities.
The same principle appears in pharmacies. Frequently purchased health products may generate predictable traffic, while nearby personal-care products benefit from that traffic. In convenience stores, beverages positioned near ready-to-eat food can influence basket composition. In department stores, accessories positioned between major apparel zones can capture customers moving between categories.
Layout therefore changes not only where sales happen but also how different sections contribute to one another.
Assortment Determines What the Space Can Produce
Physical space is limited. Assortment decisions determine which products are allowed to compete for that space.
A common mistake is assuming that carrying more products automatically increases customer choice and therefore sales. In reality, assortment expansion can create duplication. Several Stock Keeping Units (SKUs) may satisfy almost identical customer needs while individually selling slowly.
The result is a shelf that appears full but is economically unproductive.
A stronger assortment strategy asks:
- Which products genuinely contribute incremental demand?
- Which SKUs overlap heavily with alternatives?
- Which categories deserve more facing or display capacity?
- Which products attract traffic even if their direct sales are lower?
- Which products generate strong sales despite limited space?
- Which products repeatedly occupy space without sufficient demand?
A beauty retailer, for example, may discover that a relatively small skincare category contributes disproportionately high sales, while several slow-moving fragrance variants consume extensive display space. A sporting-goods store may find that footwear needs more space because of size variants but still delivers stronger productivity than certain bulky equipment categories.
The important point is that space allocation and assortment planning cannot be separated.
Merchandising Changes How Productive the Same Assortment Can Be
Even with the right products and the right amount of space, poor merchandising can reduce productivity.
Products may be placed in the wrong sequence. Promotional materials may obscure merchandise. High-demand items may receive insufficient facings. Products intended to be purchased together may be separated. Empty shelf spaces may remain unnoticed during busy trading hours.
In these situations, the problem is not necessarily insufficient demand or excessive store size. The store may simply be failing to convert its available space into sales effectively.
This is where planogram compliance and On-Shelf Availability (OSA) become directly connected to store productivity. A retailer may theoretically allocate the right amount of space to a category, but if products are missing from the shelf, misplaced, or displayed differently from the intended planogram, the actual commercial performance of that space can fall below its potential.
Digitalplace.ai supports retailers in connecting store execution with better retail decision-making through solutions including On-Shelf Availability and planogram monitoring. Instead of treating shelf compliance as a purely visual issue, retailers can use store-level observations to identify where planned merchandising and actual shelf conditions begin to diverge.
Sales per Square Foot Should Not Be Read Without Inventory
Imagine that two store sections each generate USD 300,000 annually.
Section A occupies 1,000 square feet.
Section B occupies 600 square feet.
From a space perspective, Section B looks considerably more productive.
But suppose Section B requires substantially more inventory, experiences frequent stockouts, and has high replenishment complexity. Suddenly the comparison becomes more complicated.
Sales per square foot measures space productivity, not inventory efficiency, profitability, or service level. Retailers therefore need to interpret the metric alongside other indicators such as inventory turnover, gross margin, sell-through, On-Shelf Availability, conversion, and stock cover.
A section can generate strong sales per square foot while still tying up too much working capital. Another section may have relatively modest direct sales but deliver high margins. A fast-moving category may appear highly productive but lose substantial potential sales because the shelf repeatedly runs empty.
Looking at the KPIs together produces a much more accurate picture of retail productivity.
The Same Benchmark Does Not Work for Every Retail Format
Sales per square foot varies enormously by retail category.
A jewelry store, furniture showroom, supermarket, bookstore, electronics retailer, pharmacy, and convenience store operate with completely different economics. Their average transaction values, product dimensions, inventory requirements, margins, store formats, and customer missions are different.
Even stores within the same retail chain may require different expectations.
A flagship store in a major shopping district may carry broader assortments and provide experiential areas. A smaller neighborhood store may emphasize fast-moving products and convenience. A store near an office district may experience strong weekday demand, while a suburban branch may depend more heavily on weekends.
For that reason, the most useful comparisons are usually:
Store vs. its own historical performance
Is the same store becoming more productive?
Store vs. similar store formats
How does a 3,000-square-foot location compare with other stores of similar size and purpose?
Department vs. department
Which categories justify their current allocation?
Space productivity vs. margin and inventory productivity
Are stronger sales also producing stronger economic outcomes?
External industry benchmarks can provide context, but internal comparisons are usually more actionable.
What Happens When a Section Underperforms?
Low sales per square foot does not automatically mean the retailer should remove the category.
Instead, it should trigger diagnosis.
The retailer needs to determine why the space is underperforming.
Possible causes include weak customer demand, excessive assortment, poor product placement, low On-Shelf Availability, inadequate replenishment, oversized displays, weak promotional execution, or simply allocating too much space relative to the category’s importance.
The response may therefore differ dramatically.
A retailer might:
- reduce slow-moving SKUs;
- reallocate shelf space to stronger categories;
- improve product positioning;
- adjust the planogram;
- increase availability of high-demand items;
- move inventory between stores;
- revise replenishment quantities;
- test cross-merchandising opportunities; or
- reconsider whether the category plays a strategic role beyond direct sales.
This is why retail productivity should be treated as a decision problem, not merely a reporting metric.
Space Productivity Is Also a Local Demand Problem
One of the most important lessons in multi-store retail is that the same amount of space should not necessarily contain the same assortment everywhere.
Demand varies by location.
A convenience store near a university may sell very different products from the same chain’s store in a residential neighborhood. A pharmacy near a hospital may have a different product mix from one inside a shopping mall. A sporting-goods store in a coastal city may require different category emphasis from a store serving an urban business district.
Yet retailers often standardize store layouts because standardization simplifies operations.
The challenge is finding the balance between consistency and local relevance.
A standard planogram may establish a useful operational baseline, but store-level demand data can reveal where space allocation needs adjustment. When local demand consistently differs from the standard assortment, forcing identical shelf allocation across every branch can reduce both space productivity and inventory productivity.
Connecting Space Decisions With Inventory Optimization
This is where store productivity increasingly overlaps with inventory optimization.
If a retailer knows which products generate demand at each location, it becomes easier to determine not only how much inventory should be replenished, but also whether the current assortment and space allocation make sense.
Digitalplace.ai’s Inventory Optimization approach focuses on turning demand signals into more practical inventory and replenishment decisions across stores. When retailers combine demand forecasting, inventory position, replenishment requirements, and store-level performance, they gain a stronger basis for deciding which products deserve more inventory, which stores require different quantities, and where inventory should potentially be rebalanced.
The important shift is from looking at store space as a fixed physical constraint to treating it as an asset that should continuously reflect customer demand.
A Better Way to Think About Retail Space
Traditional space planning can become surprisingly static.
A store opens with a particular layout. Categories receive fixed areas. Fixtures are installed. Planograms are created. Unless a major refurbishment happens, the physical structure may remain largely unchanged for years.
Customer demand does not behave that way.
Products become more or less popular. New categories emerge. Pack sizes change. Promotions alter shopping behavior. Neighborhood demographics evolve. Certain stores develop local purchasing patterns that differ from the wider chain.
Retailers therefore need to periodically ask whether historical space decisions still reflect current customer behavior.
Sales per square foot provides a useful signal because it exposes situations where physical allocation and commercial performance may be drifting apart.
But the strongest decisions emerge when that signal is combined with assortment performance, inventory data, margin, availability, and customer behavior.
From Store Productivity to Better Retail Decisions
A productive retail store is not simply a store with more products, fuller shelves, or higher sales.
It is a store where space, inventory, assortment, merchandising, and customer demand work together.
Sales per square foot helps retailers understand whether their physical footprint is generating sufficient commercial value. When performance is weak, the KPI can guide deeper questions about layout, category allocation, assortment, shelf execution, and inventory.
When performance is strong, retailers can investigate what is driving that productivity and whether those lessons can be applied elsewhere.
The real objective is therefore not to maximize a single ratio.
It is to make every part of the store earn its place.
For retailers managing dozens or hundreds of locations, that requires increasingly granular decisions. Different stores may need different assortments. Different categories may deserve different space allocations. Replenishment must reflect local demand rather than simply copying historical averages.
Digitalplace.ai helps retailers connect these decisions across inventory optimization, demand forecasting, automatic replenishment, and store-execution technologies such as On-Shelf Availability monitoring. The goal is not simply to fill more space, but to help retailers understand where demand exists and translate those signals into better inventory, shelf, and store decisions.
Ultimately, sales per square foot is valuable because it forces retailers to reconsider something that is easy to take for granted:
The store floor is not just where products are displayed. It is a limited commercial resource—and every square foot should have a purpose.