Every store has two kinds of money it never sees on the sales report. The first is money frozen on the shelf — stock that was bought, paid for, and is now just sitting there aging, while the cash that could have bought next season’s bestsellers stays trapped inside it. The second is money that simply walks out the door: a unit that was on the books this morning and is gone tonight, with no sale to show for it. Neither shows up as a line you can point to. Both quietly eat your profit.
Revenue tells you what came in. Sell-through and shrinkage tell you what your inventory and your controls are actually doing with it.
The short version, before we dig in:
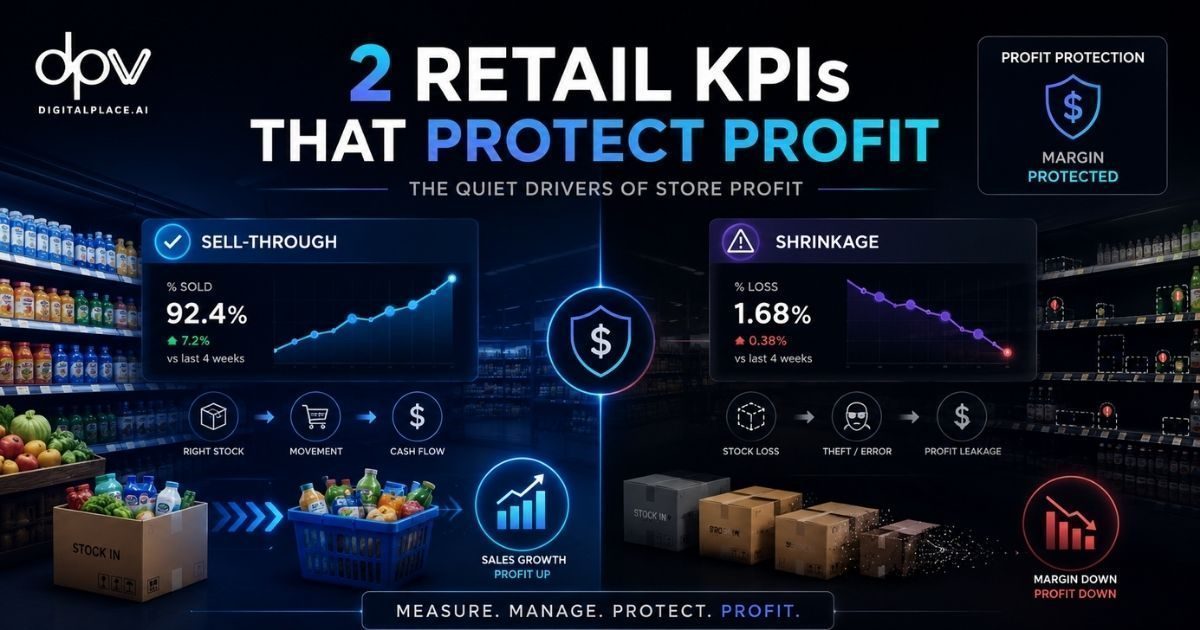
- Sell-Through % shows how much of the stock you brought in actually sold within a period — high means your inventory is working, low means cash is stuck on the shelf.
- Shrinkage % shows how much stock disappears without ever being sold — lost to theft, error, or damage — quietly draining profit you already paid for.”
- One protects your cash flow. The other protects your margin. Ignore either, and a store that looks profitable on the surface can still bleed underneath.
These are the final two of the six KPIs every store manager must own — and the pair most managers measure least. The first four KPIs (conversion, ATV, UPT, IPC) decide how well you sell. These last two decide how well you protect what selling earns you. Call them the profit-protection KPIs.
What sell-through and shrinkage actually mean
Before the formulas, the plain-language definitions, because these two are constantly confused.
Sell-through rate measures how much of the stock you brought in actually sold within a given period. It is a health check on demand and buying: did you order the right things, in the right quantity, and did they move? A high sell-through means your inventory is working hard; a low one means cash is sitting still on your shelves.
Shrinkage measures the stock that vanished without a legitimate sale — the gap between what your records say you should have and what a physical count actually finds. It is a health check on your controls: theft (external and internal), administrative and counting errors, vendor short-shipments, and damage. Where sell-through asks “is my stock moving?”, shrinkage asks “is my stock leaking?”
Sell-Through %: is your stock working?
Formula: Sell-Through % = (Opening Stock − Closing Stock) ÷ Opening Stock × 100
In plain terms, it is the share of what you started with that you sold by the end of the period. Target a range of 60–80% per month during the in-season period. That band is the sweet spot: enough movement to keep cash and shelves working, without selling out so fast that you leave money on the table.
Reading the signal: below 60% vs above 80%
The number is only useful if you know how to react to it:
- Below 60% → you have an aging problem. Stock is moving too slowly. Capital is trapped, the goods are drifting toward end-of-season markdowns, and shelf space that should be earning is sitting idle. Time to investigate pricing, placement, or whether you simply over-ordered.
- Above 80% → you need to reorder faster. Strong demand is great, but if you sell through too hard, too early, you run out of the very items customers came for — and every empty shelf is a sale handed to a competitor. The fix is quicker replenishment, not celebration.
A quick worked example
Say a fashion SKU starts the quarter with an opening stock of 500 units. By the end of the period, 350 of them have sold. Your sell-through is 350 ÷ 500 × 100 = 70% — right in the healthy band. The same 350 units might represent, say, USD 175,000 in sales, but the 70% is what tells you the buy was well-judged: strong movement, with a sensible 30% cushion still on hand.
Good vs poor sell-through: what’s actually at stake
The gap between a healthy sell-through and a weak one is not academic — it shows up directly in cash, margin, and space.
Strong sell-through (around 85%) maximizes profitability, requires minimal markdowns, keeps cash flow healthy, and makes optimal use of your floor and stockroom. Your money keeps cycling into fresh, in-demand product.
Poor sell-through (around 20%) does the opposite: it ties up capital in stock that won’t move, forces deep markdowns to clear it, racks up storage and holding costs, and carries a real risk of obsolescence — product that ages out of relevance before it ever sells. In fashion and seasonal categories especially, slow stock doesn’t just sit; it loses value while it sits.
This is exactly the band that’s hard to hold by gut feel, because it depends on forecasting demand accurately and reordering at the right moment — fast enough on the winners, restrained enough on the rest. It’s the problem digitalplace.ai is built to solve: its AI-driven demand forecasting and automated replenishment are designed to keep sell-through in that healthy 60–80% range — reordering quickly on items pushing past 80%, while avoiding the over-ordering that leaves slow movers stuck below 60%. In other words, fewer stockouts on your bestsellers and less dead capital on your shelves at the same time.
Shrinkage %: is anything leaking?
Formula: Shrinkage % = Stock Variance ÷ Cost of Goods × 100
Stock variance is simply the difference between the inventory your system says you should have and what a physical count actually finds. Keep it below 1.5% of cost of goods (COGS). Anything drifting higher is a signal that something — theft, process, or paperwork — isn’t under control.
A note on benchmarks, so you compare like with like. Most published industry figures measure shrinkage as a percentage of *sales*, not cost of goods: the U.S. National Retail Federation’s most recent survey put the average at roughly 1.6% of sales, and Sensormatic’s global index has run even higher, around 1.8%. Loss-prevention specialists generally treat under 1% of sales as healthy and above 2% as a sign of structural gaps. Because the formula above uses cost of goods rather than sales as its base, your internal number won’t line up one-to-one with those headlines — so pick one definition, apply it consistently, and track your own trend rather than chasing the press release.
The silent USD 15,000
Here is why a number that sounds tiny deserves real attention. Take a store doing USD 2 million in revenue at a 50% margin — so roughly USD 1 million in cost of goods. A shrinkage rate of just 1.5% means about USD 15,000 of stock walking out the door, silently, every single year. No alarm, no single dramatic event — just a slow leak.
And the sting is sharper than it looks, because shrinkage comes straight off the bottom line, not the top. That USD 15,000 isn’t lost revenue you can partly recover through margin — it’s lost profit, money you already paid for and will never sell. On a thin net margin, a 1.5% shrink can quietly erase a double-digit share of the profit you worked all year to earn.
Two KPIs, one job: protect the profit you already earned
Read together, sell-through and shrinkage tell you whether the money your sales floor brings in actually survives the journey to your bottom line. Sell-through asks whether your buying and replenishment are sharp enough to keep stock moving and cash cycling. Shrinkage asks whether your counts, processes, and controls are tight enough to stop that stock from quietly disappearing.
Both depend on the same unglamorous foundation: knowing, accurately and in near real time, what you actually have. You cannot manage sell-through if your stock figures are stale, and you cannot catch shrinkage if your system count drifts from reality for weeks before anyone reconciles it. Connected inventory intelligence like digitalplace.ai closes that gap — keeping stock data accurate from supplier to warehouse to shelf, so a sell-through dip or a shrinkage leak surfaces while you can still act on it, not at the post-mortem after the quarter closes.
So as you finish this series, remember the shape of the whole engine. The first four KPIs grow the sale; these last two protect it. A great conversion rate means little if the stock you sold so well was bleeding margin on one side and aging into markdowns on the other. Master all six together, and you stop reacting to last month’s revenue — you start steering the store that produces it.
Your homework: pull your opening and closing stock for one key category this month and calculate its sell-through. Then run your last physical count against your system figure and work out your shrinkage. Two numbers, fifteen minutes — and a far clearer view of where your profit is really going.
Want to keep sell-through in the healthy band and catch shrinkage before it compounds? See how the AI-driven inventory solutions at digitalplace.ai help retailers protect their margins.

 Profit-Protection KPI Map