Two stores sit side by side in the same mall. They get almost identical footfall — roughly 500 people walk past and into each one on a Saturday. By closing time, Store A has rung up 90 sales. Store B has rung up 175. Same traffic, nearly double the transactions. No extra marketing, no bigger budget, no better location. The only difference lived inside four numbers that Store B’s manager watched like a hawk and Store A’s manager had never measured.
“Footfall is the opportunity. Conversion is the execution.” The traffic gets people through the door; these four KPIs decide what happens next.
The quick version, if you read nothing else:
- Conversion tells you how many visitors bought at all.
- ATV tells you how much each buyer spent.
- UPT tells you whether your team sells one item or builds a basket.
- IPC tells you how loaded the basket is per shopper.
These are the four “sales-floor” KPIs from the six every store manager must own. The first article in this series argued that revenue is the rearview mirror and KPIs are the engine. These four are the part of the engine you can rev today — because every one of them is about converting traffic you have already paid for into a bigger sale.
1. Conversion Rate — did they buy at all?
This is the first lever, and almost always the most valuable one.
Formula: Conversion % = (Transactions ÷ Footfall) × 100
So if 500 people came in and 140 of them bought something, your conversion is 28% — and for fashion or footwear, that is a strong number.
What “good” looks like — and where the number comes from. Most published in-store conversion benchmarks come from specialty-retail data in the US, UK, and Europe, so treat them as directional, not gospel. With that caveat:
- Fashion and apparel: roughly 20–30%.
- Footwear and specialty: roughly 25–35%.
- Electronics and big-ticket (furniture, appliances): often only 10–20%, because people deliberate longer.
- Grocery, convenience, and snack/FMCG formats: typically 60% or higher. Almost everyone walking into a minimarket already intends to buy — they came for something specific — so the conversion ceiling is much higher than in browse-heavy fashion.
Is there a Southeast Asia benchmark — Indonesia, Singapore, the region? Honestly, no widely published in-store conversion benchmark exists for any single Southeast Asian market — not for Indonesia, not for Singapore. Even Singapore-localized retail guides fall back on the same global brick-and-mortar range of roughly 20–40%. So treat the regional picture as structural guidance, not a precise target.
What actually differs across the region is the format mix, and that is what should anchor your expectation:
- Indonesia leans heavily toward minimarkets and convenience stores — roughly 42% of the modern-trade channel mix, the largest single format. These are high-intent, top-up-basket formats, so a healthy Indonesian minimarket should expect conversion closer to the 60%+ grocery pattern than to the 20–30% fashion range.
- Singapore skews the other way: a mall- and Orchard-Road-centric landscape weighted toward specialty, fashion, and luxury, where walk-in footfall has been under real pressure lately. Those formats sit in the lower 20–40% specialty band, because much of the traffic is browsing rather than buying.
- Markets like Malaysia, Thailand, and the Philippines fall somewhere in between, depending on whether a given store is a convenience format or a mall-based specialty store.
The practical takeaway holds across all of them: your most reliable benchmark is your own store’s rolling 13-week baseline, compared like-for-like against similar stores in your own network. A regional or global number tells you the neighborhood; your own trend tells you whether you’re winning.
One warning that matters everywhere: conversion is only as honest as your footfall count. Door counters that pick up staff movement, re-entries, or people just passing through a mall will quietly inflate your denominator and make conversion look worse than it is. Clean traffic data is the foundation — which is exactly why retail operations platforms such as digitalplace.ai focus on capturing accurate store-level signals before anyone tries to act on them. Garbage footfall in, garbage conversion out.
Retail KPI Interactive Guide
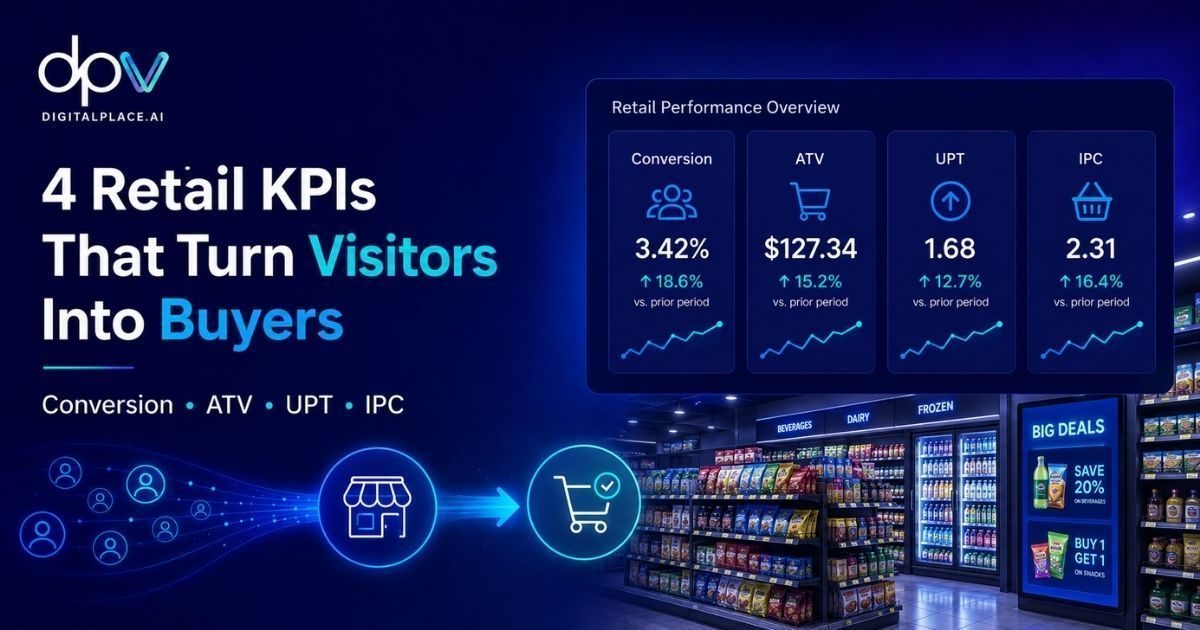
4 Retail KPIs That Turn Visitors Into Buyers
Footfall is the opportunity. Conversion, ATV, UPT, and IPC show what happens after shoppers enter the store — whether they buy, how much they spend, and how strong the basket really is.
Click a KPI to see formula, meaning, and action.
Conversion Rate
Formula: Transactions ÷ Footfall × 100
Conversion answers the most important question: did the visitor buy at all?
ATV — Average Transaction Value
Formula: Revenue ÷ Transactions
ATV tells you how much each buyer spends per sale.
UPT — Units Per Transaction
Formula: Total Units Sold ÷ Transactions
UPT shows whether the team is ringing up single items or building baskets.
IPC — Items Per Customer
Formula: Total Items ÷ Unique Customers
IPC measures how much one shopper takes home across the period, not just one receipt.
What moved this week?
Click each diagnosis card to see what the KPI pattern usually means.
Fix conversion first.
Visitors already chose to walk in. Converting more of the traffic you already have is often faster and cheaper than chasing new footfall.
2. ATV (Average Transaction Value) — how much did each buyer spend?
Formula: ATV = Revenue ÷ Number of Transactions
If you did SGD 8,750 in sales across 175 transactions, your ATV is SGD 50 per sale.
Why there’s no universal ATV benchmark. Unlike conversion, ATV is almost meaningless across companies, because it depends entirely on what you sell and at what price. A jeweller and a convenience store will never share an ATV target. (For scale only: North American retailers average around USD 56 per transaction — but that blends every category and currency, so it’s useless as a goal for any single store.) This is why the only benchmark that works for ATV is your own three-month average. You are not chasing someone else’s number; you are asking, “Is each customer spending more with us than they did last quarter?” Track ATV against your own rolling average, and a rising line means your pricing, mix, and upselling are working together.
3. UPT (Units Per Transaction) — one item, or a basket?
Formula: UPT = Total Units Sold ÷ Number of Transactions
UPT answers a behavioral question: when someone buys, do they walk out with a single item, or did your team help them build a basket?
Benchmark: for fashion and footwear, a healthy UPT sits around 2.0–3.5. Below that range and your team is likely ringing up single items and missing the add-on. Note that this benchmark, too, is drawn mainly from Western specialty-retail data; in Indonesia and across Southeast Asia, use it as a directional target and calibrate against your own categories. A minimarket’s UPT behaves very differently from a shoe store’s, so set the target by format, not by a number you read once.
UPT is essentially a scoreboard for your sales floor. A high UPT usually means associates are recommending well, the visual merchandising is pairing products intelligently (the mannequin wearing the top, the bottom, the shoes, and the bag), and customers are responding. A low or flat UPT — especially during a promotion meant to clear stock — is an early signal that either the discount isn’t landing or the floor team isn’t highlighting it.
4. IPC (Items Per Customer) — and how it differs from UPT
Formula: IPC = Total Items ÷ Unique Customers
Benchmark: roughly 1.8–3.0 for a mixed-category store — again, directional, Western-sourced, and best calibrated to your own baseline.
Here’s the part that trips up a lot of managers, because much of the retail industry actually uses “UPT” and “IPC” interchangeably. In this framework they are deliberately separated, and the distinction is useful:
- UPT is per transaction — per receipt. One shopper who makes two separate purchases in a day shows up as two transactions.
- IPC is per unique customer — across all their visits in the period.
So UPT tells you how good a single checkout is at being loaded up; IPC tells you how much one shopper takes home in total, even across multiple trips. When IPC runs noticeably higher than UPT, it means customers are coming back and buying again — a loyalty signal, not just a basket signal. Watching both keeps you from celebrating a fat single basket while quietly losing repeat visits, or vice versa.
Reading all four together: a sales-team diagnosis
Individually, each number is interesting. Together, they’re a diagnostic tool that tells you exactly where your sales floor is leaking — something a single revenue figure can never do.
Picture a soft week. Revenue is down. Where’s the problem?
- Footfall steady, conversion down → traffic is fine, but the team isn’t closing. This is a service, staffing, or floor-coverage issue, not a marketing one.
- Conversion fine, ATV down → people are buying, but spending less. Check your product mix, your price points, and whether premium options are being shown.
- ATV down and UPT down together → baskets are shrinking. Your team is ringing up single items and missing the add-on; this is an upselling and merchandising fix.
- UPT healthy but IPC flat → individual baskets are fine, but shoppers aren’t coming back. That’s a loyalty and experience problem, not a floor problem.
This is the real payoff. You stop asking the useless question — “why are we down?” — and start asking the precise one — “which of the four moved, and what behavior fixes it?” The catch is that this diagnosis only works when footfall, transactions, units, and customer data line up cleanly for the same period. When those numbers live in four disconnected systems, the moment to act passes before you’ve finished reconciling spreadsheets. Connected retail tooling like digitalplace.ai exists precisely so store managers can read these four KPIs side by side, in something close to real time, instead of stitching them together by hand after the week is already lost.
A closing principle worth tattooing on the back of your hand: of these four, fix conversion first. Those visitors already chose to walk in. Converting more of the traffic you already have is almost always cheaper and faster than chasing new footfall — and once conversion is stable above your format’s benchmark, ATV, UPT, and IPC become the levers that grow the basket.
In the next article, we move from the sales floor to the stockroom — Sell-Through and Shrinkage, the two KPIs that quietly decide whether your inventory is making you money or bleeding it.
Curious how connected, store-level KPI tracking actually works in a multi-store operation? Take a closer look at the retail AI solutions at digitalplace.ai.