A store manager once told me he checked his revenue every single morning. First thing, before coffee, he opened the report and looked at yesterday’s sales. If the number was up, it was a good day. If it was down, it was a bad one. He did this for years and never understood why he could not control the outcome — only react to it.
The problem was not his discipline. It was where he was looking.
Revenue is the result. The KPIs are the engine. If you only watch your revenue, you are looking at the rearview mirror. If you manage your KPIs, you are steering the car.
That single shift in thinking is the difference between a manager who explains last month and a manager who shapes next month. Revenue tells you where you have already been. The Key Performance Indicators sitting underneath it tell you where you are going — and, more importantly, what you can do about it right now.
Why revenue alone keeps you stuck
Here is the trap. Revenue is a lagging number. By the time it lands on your dashboard, the day is over, the customers have gone home, and the opportunities are spent. You can feel good or bad about it, but you cannot change it. Watching it obsessively is like driving while staring into the mirror: you will see exactly what you crashed into, just a little too late.
The KPIs are different. They are the levers in front of you. Each one is a piece of behavior you can actually influence today — how many people convert, how big their basket is, how fast your stock moves. Move a lever, and revenue moves with it. That is the whole game, and it is why a clear KPI habit changes how you see your store forever.
The six KPIs that tell you everything
There are six numbers that, together, give you a complete picture of your store’s health. Master these and you rarely need to guess what is wrong.
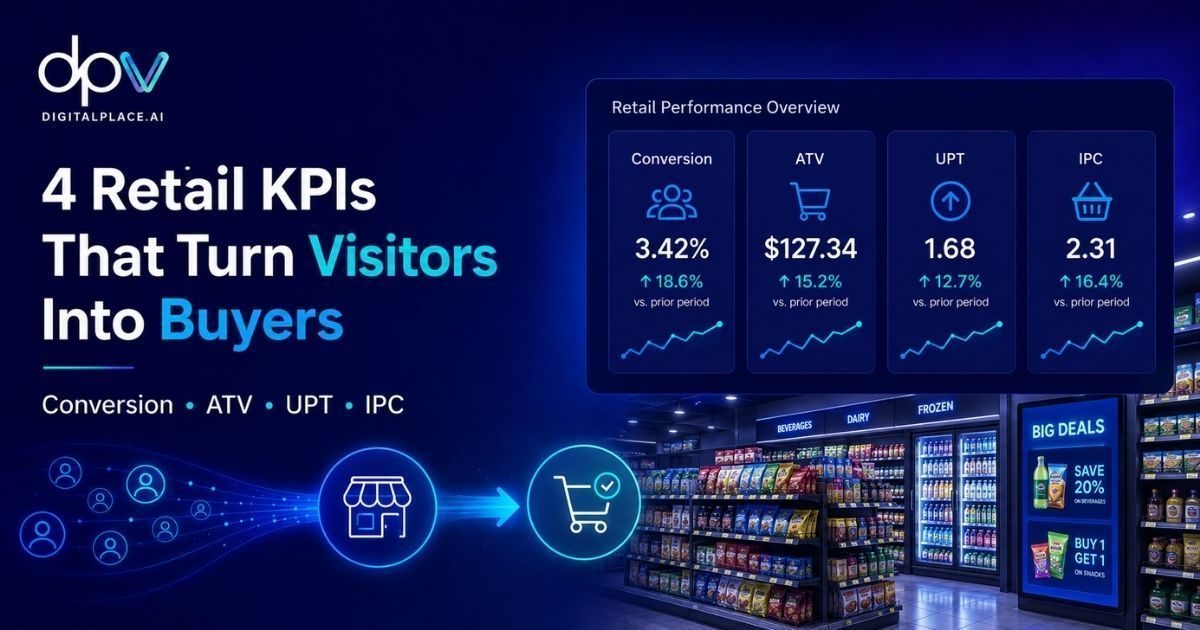
- Conversion Rate — the percentage of people who walked in and actually bought something.
- Average Transaction Value (ATV) — how much each customer spent per visit.
- Units Per Transaction (UPT) — how many items were in each sale.
- Items Per Customer (IPC) — the total items per unique shopper.
- Sell-Through % — how much of your stock actually sold this period.
- Shrinkage % — the stock that disappeared without ever being sold.
One picture, six numbers. The first four tell you how well you turn traffic into bigger baskets. The last two tell you whether your stock is working and whether your controls are holding. We will go deep on each in the next articles — for now, the point is simply that these six, watched together, leave very few blind spots.
The master formula that ties it together
If you remember nothing else, remember this:
Revenue = Footfall × Conversion% × ATV
This is the equation that turns revenue from a mystery into a set of dials. Footfall is how many people came in. Conversion is the share who bought. ATV is how much each buyer spent. Multiply them and you get sales.
Now the formula stops being math and starts being strategy. Sales are down this week — but is it because fewer people came in (footfall), because your team isn’t closing (conversion), or because baskets shrank (ATV)? The headline revenue number can’t tell you. The KPIs can. You stop asking “why are we down?” and start asking “which dial moved, and how do I turn it back?”
The six KPIs are connected — pull one, the others respond
The real magic is that none of these numbers live alone. They form a chain.
Footfall multiplied by conversion gives you transactions. Transactions multiplied by ATV give you revenue. UPT and IPC reveal whether your team is selling a single item or genuinely building a basket. Sell-through tells you whether your stock is moving the way it should. Shrinkage tells you whether your controls are working. Improve one, and the others respond — which is exactly why scattered, one-off fixes rarely stick.
And if you only have time to focus on one lever first, make it conversion. It is the cheapest growth you own: those people already walked through your door, already spent the effort to come in. Converting more of the traffic you already paid for is almost always faster than chasing more footfall. Conversion first, always.
Stop guessing, start steering
The hardest part for most managers is not understanding these KPIs — it is capturing them cleanly, week after week, across every store, without it turning into a spreadsheet nightmare. Footfall counters drift, transaction data sits in one system, stock data in another, and by the time you stitch it together the moment to act has passed.
This is where having the right operational backbone matters. Platforms like digitalplace.ai are built specifically for retailers who want their store-level numbers — traffic, inventory, sell-through, and stock accuracy — connected and visible instead of scattered. When the engine readings are clean and current, you spend your energy steering rather than reconciling, which is the entire promise behind digitalplace.ai‘s retail-focused tooling.
So here is the mindset to carry forward: revenue is the scoreboard, but the KPIs are the game. The manager who learns to read all six — and act on them while the day is still in front of them — is the one who stops reacting to results and starts producing them.
Your homework: open your KPI dashboard right now and enter this week’s numbers for each of your stores. Don’t analyze yet. Just see them, all six, in one place. That habit alone puts you ahead of every manager still squinting into the rearview mirror.
In the next article, we go deep on the four KPIs that decide how many of your visitors actually buy — and how big their baskets get.
Want to see how connected, real-time retail KPIs look in practice? Explore the retail AI solutions at digitalplace.ai.